Sometimes there are errors in user sessions that are caused by some network configuration or some system limitation, or even some intermediate element (proxy) between Athento and the user's browser, and the Athento server itself does not have any information about what is happening.
In these cases Athento does not have a trace because the call does not really reach the server, and it is necessary to check a little more in detail from the browser what is happening.
The first step is to take the console out of the browser and check for errors.
https://athento.zendesk.com/knowledge/articles/360011024540/es?brand_id=666651
For example:

That error capture, where it says "Unexpected token < in JSON at position 1", is a typical error where when we don't see any trace from the Athento side on the server, it's probably because some intermediate element has blocked the call and returned some message that the application doesn't expect.
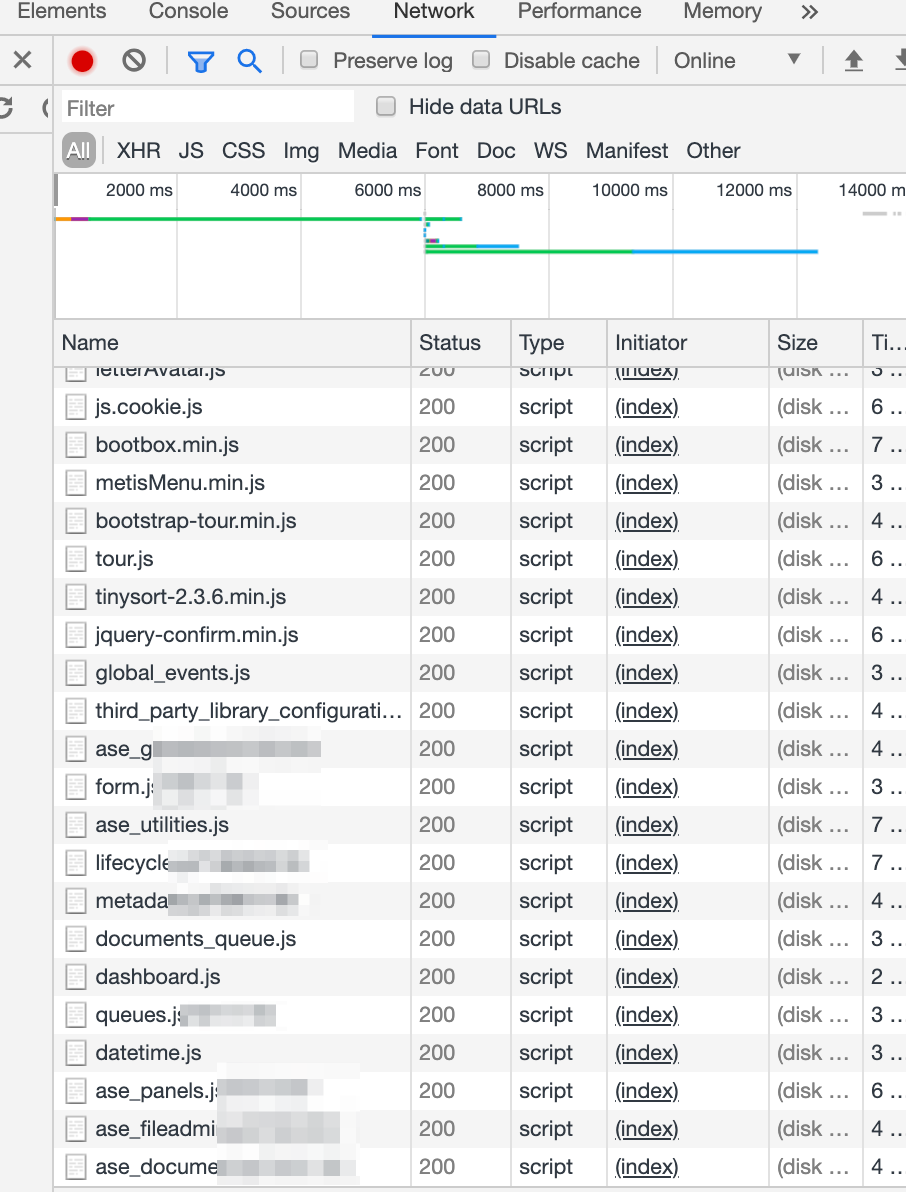
At this point it is necessary to open the Network tab and analyze the failed call, view the "request" and view the "response".
To do so, we follow the steps below:
1 - With the browser console open, we go to the Network tab
2 - We execute the action that we expect to cause the error we hope to debug and we see that new lines appear in Network (one for each call to the server).

3 - Locate the one (or ones) that does not have a 200 in the response code. Click on it to see the detail.

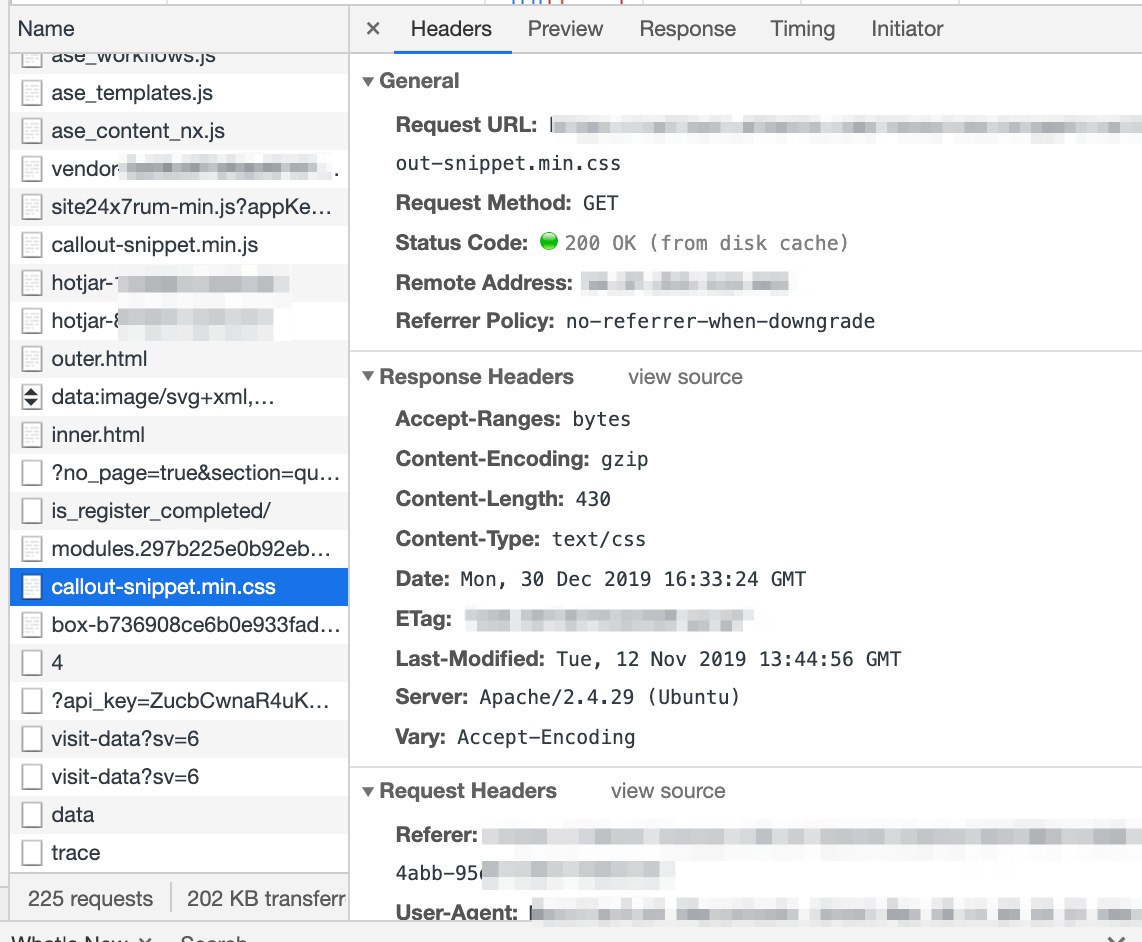
4 - We review the request and response, and share it with Athento by taking a screenshot. Example:
And from the response, you get both the Preview and the Response (one is a preview, the other the response as you get it):
Comments
0 comments
Please sign in to leave a comment.