From the space, you can consult some statistics of the space. For example, the number of documents uploaded or the percentage of fields completed by hand versus the percentage of data extracted by Athento.
Activate space statistics
To activate the statistics, from the space administration in the Information tab, Basic Configuration panel, activate the Statistics option.

View space statistics
The statistics are available from the Stats tab of the space
Meaning of statistics
The following is a review of some of the statistics available in the series or application.
Documents created, validated, manually or automatically validated in the last 30 days
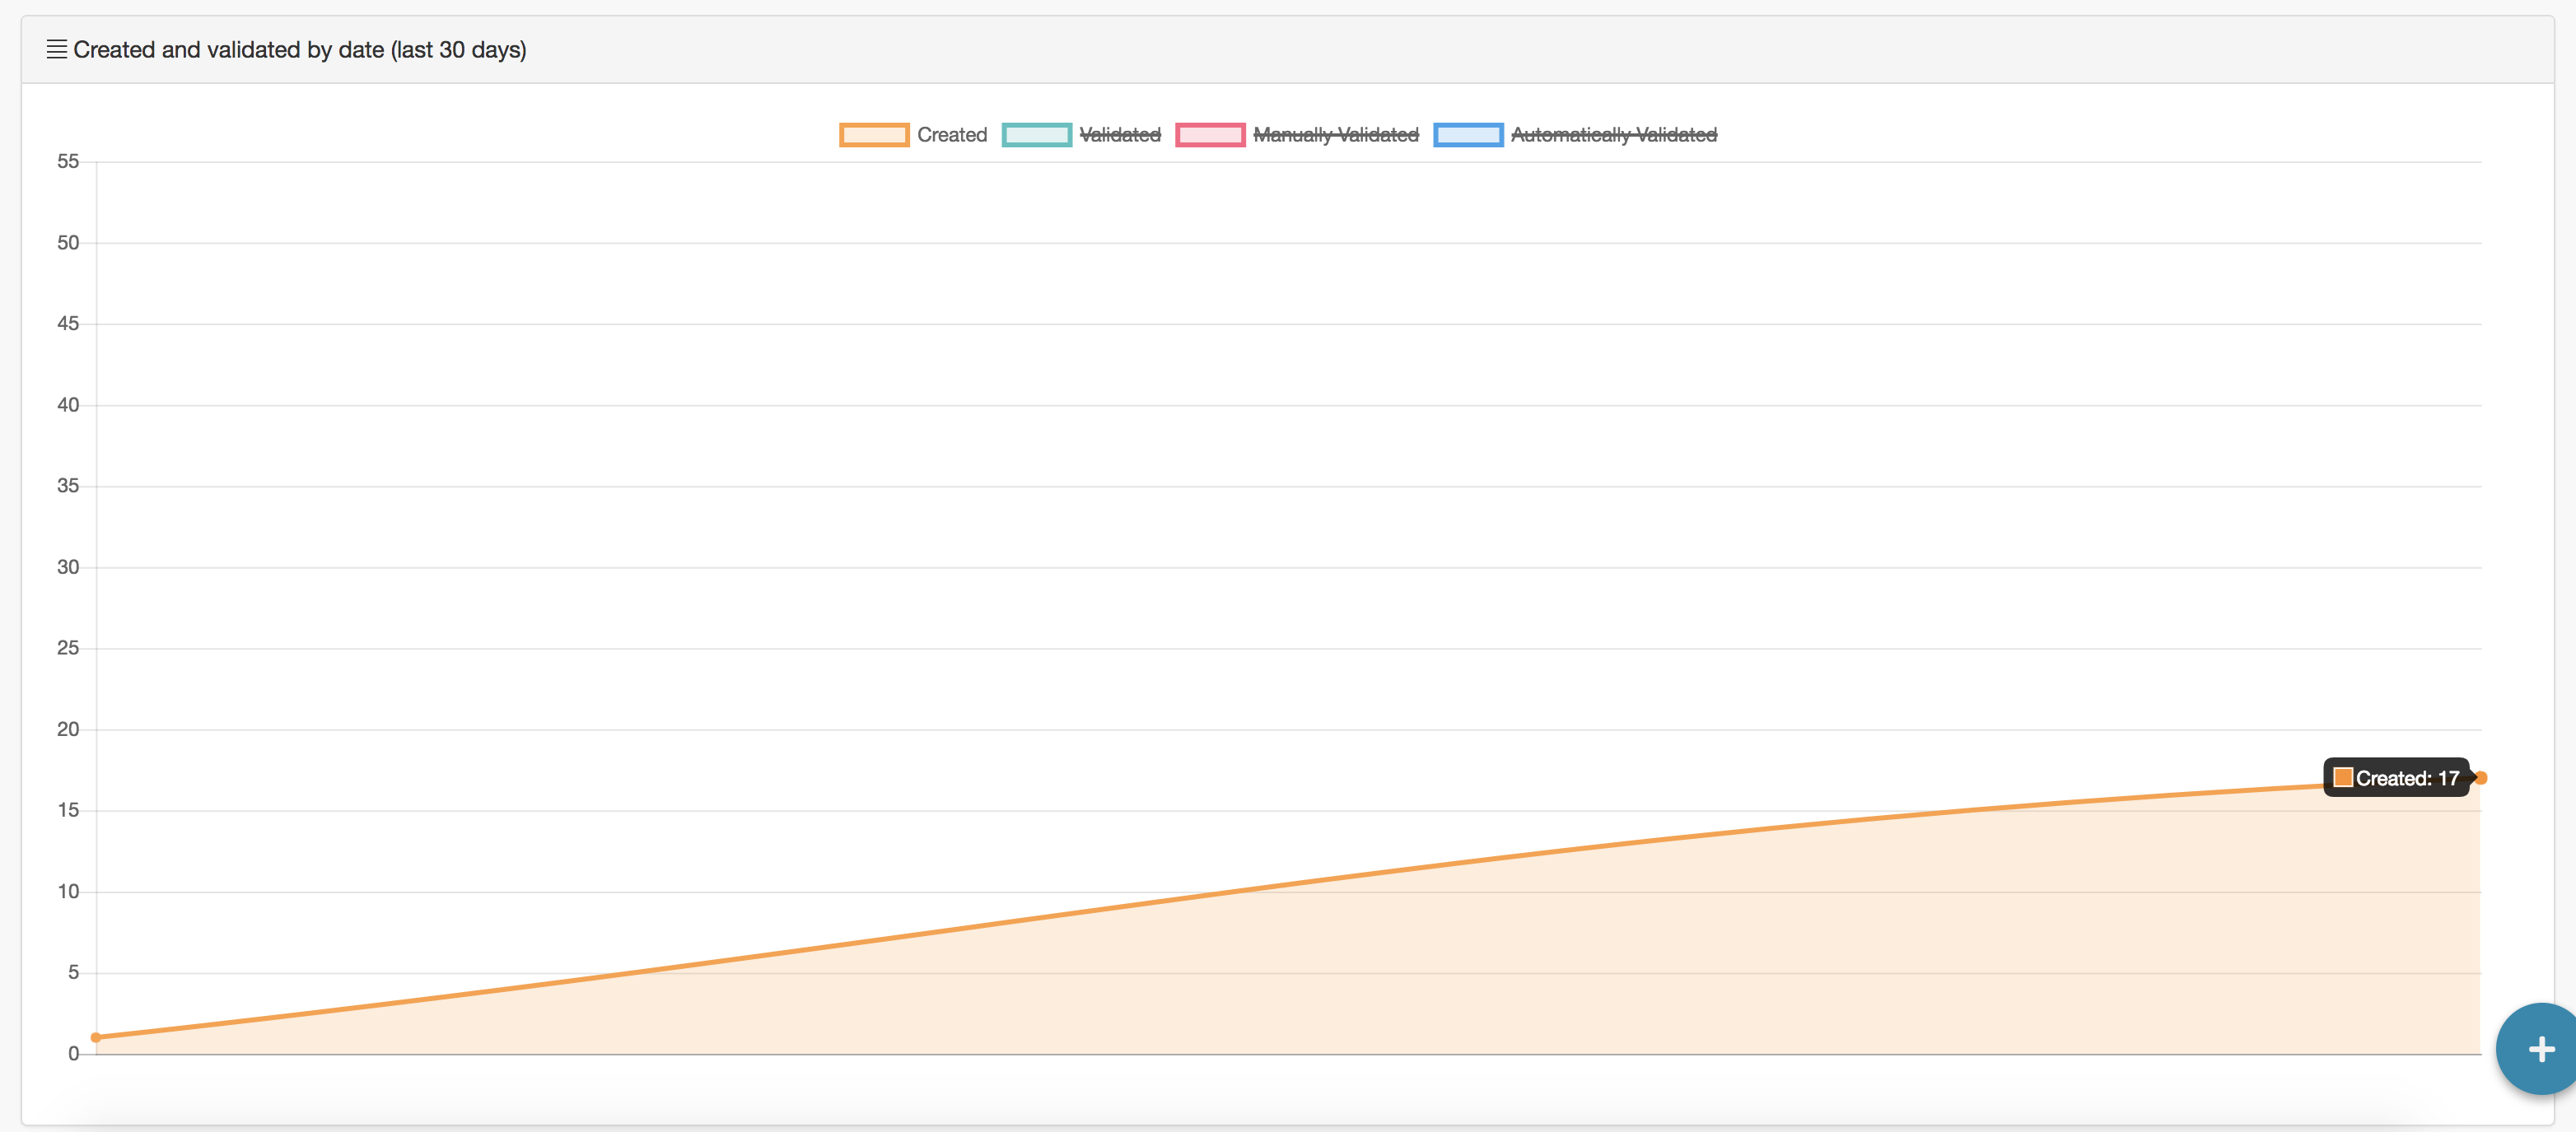
You can consult this statistic at the bottom of the statistics page. The graph shows the evolution of the documents in the space that have been created and validated in the last 30 days. It also shows the evolution of the number of documents validated manually or automatically in the last 30 days.
To remove data from the chart, click on the category you do not want to see, for example Validated.
Place the cursor over the start or end point of the graph to see the number of documents.

Manually populated fields vs. automatically populated fields
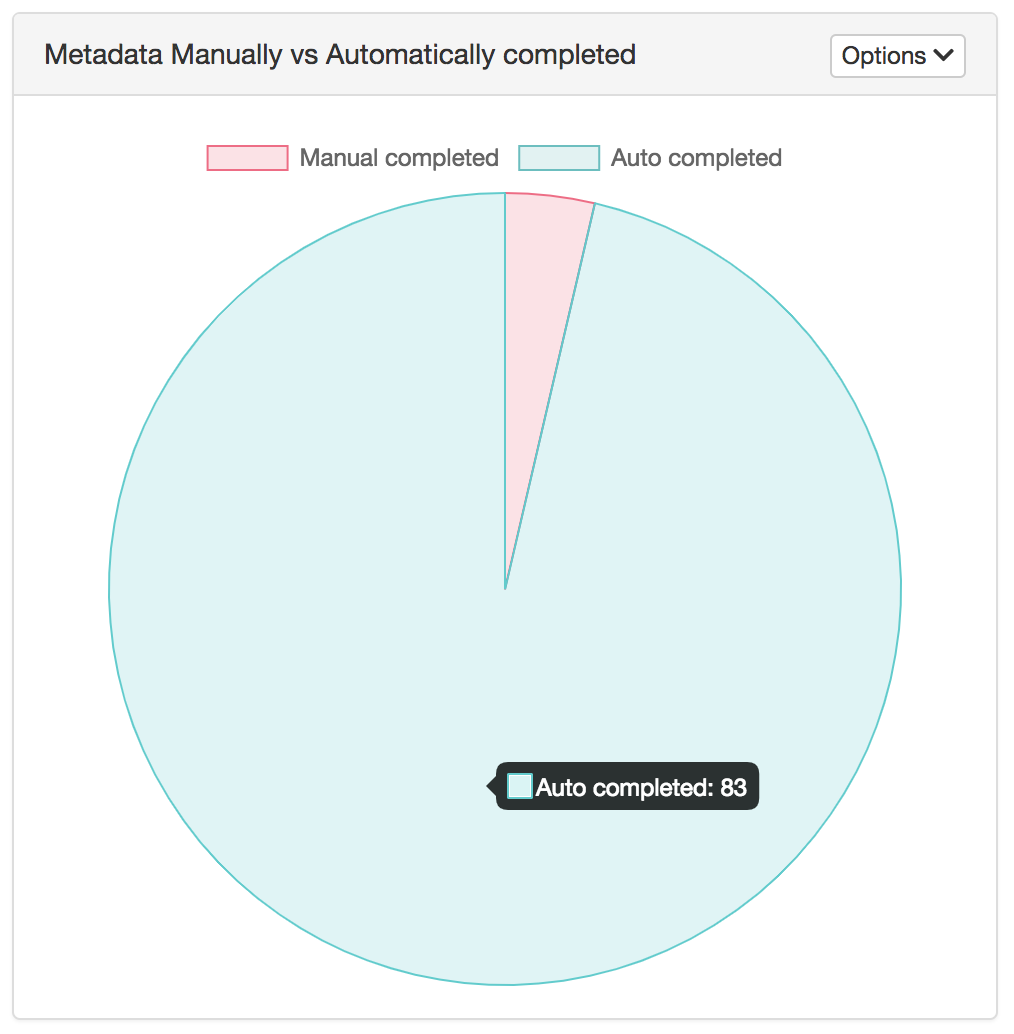
It is possible to query for the documents in a space, the degree to which the form fields are being completed manually or automatically.
The following graph shows the percentage of fields completed by users vs. the percentage of fields extracted automatically. Note that this percentage is calculated from the averages of each form.

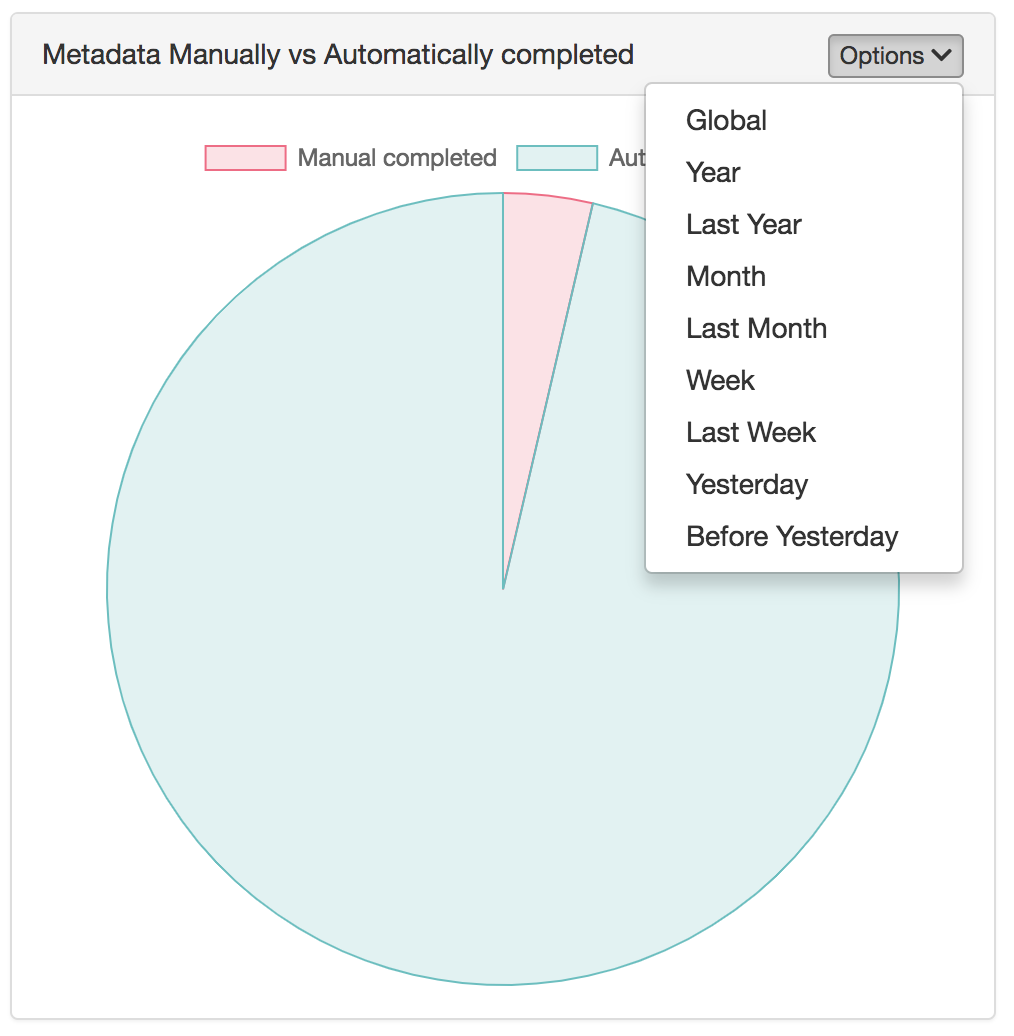
Use the Options menu to set the period over which you need statistics.

Comments
0 comments
Please sign in to leave a comment.